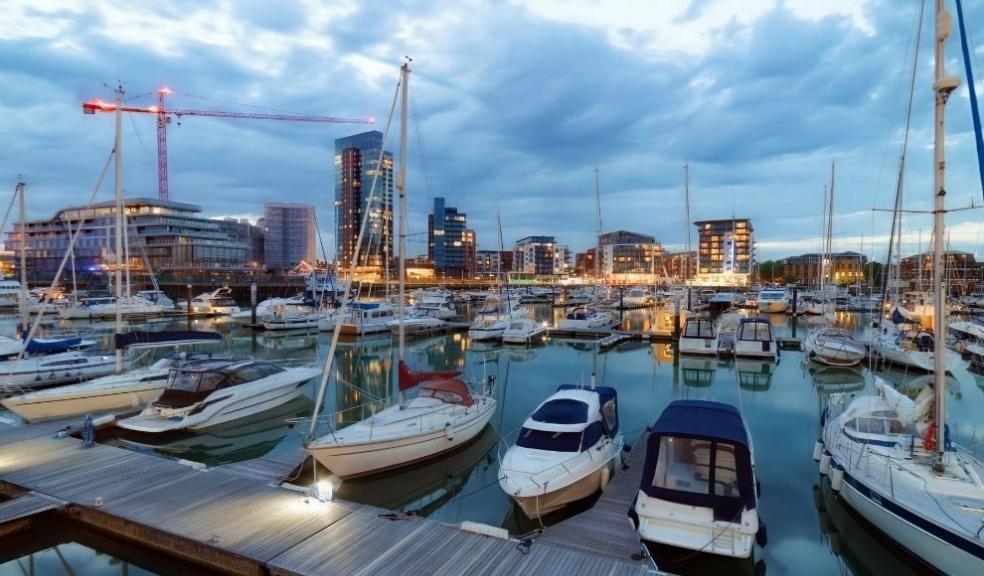
Sailing hotspot house prices for boat owning homebuyers
With summer fast approaching it’s not just the draw of the beach that makes the UK coastline an attractive proposition, with an estimated 950,000 of us taking to the waves in either a yacht or motorboat.
As hobbies go, it’s not the most affordable with even a modest vessel requiring an annual budget running into five figures once the cost of a berth, maintenance and running costs have been accounted for. The good news, at least, is that research from homebuying platform, YesHomebuyers, has found that some sailing hotspots are home to a bargain where property prices are concerned.
Yes Homebuyers looked at house prices in 20 areas home to some of the best marinas in the nation and found that the average cost of homeownership currently sits at £256,405, with house prices up 9.3% in the last year.
Most affordable marina hotspots
Not only is Hull the most affordable with an average house price of £120,837, but the area is also -36% cheaper than the wider cost of property in Yorkshire and the Humber.
In terms of the average price of property, Belfast also ranks as one of the most affordable at £142,934, with Argyll and Bute (£160,359), Allerdale (£160,403), Gwynedd (£176,185), North Tyneside (£177,317), Scarborough (£179,836), the Shetlands (£184,935), Plymouth (£194,157) and the Isle of Wight (£253,711) also home to some of the lowest average house prices.
Most affordable vs the wider region
Plymouth (-33%), the Isle of Wight (-27%) and Allerdale (-13%) are also some of the most affordable when compared to the wider average price of property in the region, as is Southend, North Norfolk and East Suffolk (-11%).
Least affordable marina hotspots
Tower Hamlets, home to St Katharine Docks, is the least affordable overall with an average house price of £496,247. Brighton and Hove is also one of the most expensive sailing hotspots where property prices are concerned at £405,451, as is Lymington (£373,274).
Least affordable vs the wider region
While North Tyneside ranks as one of the most affordable where average property prices are concerned, it’s actually home to the highest cost when compared to the wider region coming in 22% more expensive than the average house price in the North East.
The cost of a home is also higher in Devon (21%), Brighton (16%), the Shetlands (11%), Dorset (10%), the New Forest (7%) and Bournemouth, Christchurch and Poole (7%) when compared to the average price in the wider region.
Matthew Cooper, Founder & Managing Director of Yes Homebuyers, commented:
“Owning a yacht or motorboat is a considerable investment and so living within close proximity of your berth means more time on the water to justify this cost while doing what you love. As a result, it can often be a hugely influential factor during the homebuying process in the same way a good school or transport link might be.
Although a waterside property is always going to come at a premium, opting to live in the wider area means a more affordable property price without sacrificing that all important sailing time. The good news is, areas with some of the UK’s very best marinas can offer a good level of property affordability which is handy considering the cost of housing and running a boat can be hefty.
The other plus is that while many successful trips to the coast often require good weather, a little rain and wind can make for great sailing conditions, so when the British weather fails to deliver, you’re less likely to be disappointed.”
|
Location |
Local Authority |
Average House Price |
Annual Growth |
Region |
Average Regional House Price |
Local Authority vs Region |
|
Royal Quays |
North Tyneside |
£177,317 |
10.6% |
North East |
£145,893 |
22% |
|
Dartmouth |
Devon |
£349,346 |
13.3% |
South West |
£287,650 |
21% |
|
Brighton |
Brighton & Hove |
£405,451 |
11.9% |
South East |
£348,615 |
16% |
|
Mousa |
Shetlands |
£184,935 |
8.9% |
Scotland |
£166,566 |
11% |
|
Weymouth |
Dorset |
£315,051 |
9.3% |
South West |
£287,650 |
10% |
|
Lymington |
New Forest |
£373,274 |
10.2% |
South East |
£348,615 |
7% |
|
Poole |
Bournemouth, Christchurch and Poole |
£307,001 |
9.2% |
South West |
£287,650 |
7% |
|
St Katharine Docks |
Tower Hamlets |
£496,247 |
3.8% |
London |
£500,310 |
-1% |
|
Portavadie |
Argyll and Bute |
£160,359 |
13.6% |
Scotland |
£166,566 |
-4% |
|
Belfast |
Belfast |
£142,934 |
6.0% |
Northern Ireland |
£149,178 |
-4% |
|
Caernarfon/Abersoch |
Gwynedd |
£176,185 |
11.4% |
Wales |
£184,431 |
-4% |
|
Whitby |
Scarborough |
£179,836 |
3.1% |
Yorkshire and the Humber |
£188,575 |
-5% |
|
Falmouth/Salcombe |
Cornwall |
£273,153 |
15.5% |
South West |
£287,650 |
-5% |
|
Alderburgh |
East Suffolk |
£281,854 |
17.3% |
East of England |
£315,059 |
-11% |
|
Wells-next-the-sea |
North Norfolk |
£280,966 |
8.6% |
East of England |
£315,059 |
-11% |
|
Leigh Marina |
Southend |
£308,652 |
7.8% |
South East |
£348,615 |
-11% |
|
Maryport |
Allerdale |
£163,403 |
7.0% |
North West |
£187,924 |
-13% |
|
Cowes |
Isle of Wight |
£253,711 |
13.4% |
South East |
£348,615 |
-27% |
|
Plymouth |
Plymouth |
£194,157 |
9.0% |
South West |
£287,650 |
-33% |
|
Hull Marina |
Hull |
£120,837 |
5.2% |
Yorkshire and the Humber |
£188,575 |
-36% |
|
Average |
£257,233 |
9.3% |
UK |
£256,405 |
0.3% |
|
|
House price data sourced from the Land Registry UK House Price Index |
||||||
|
|
|
|
|
|
|
|


