The national park property hotspots helping drive country living house price growth
Country homes are proving popular
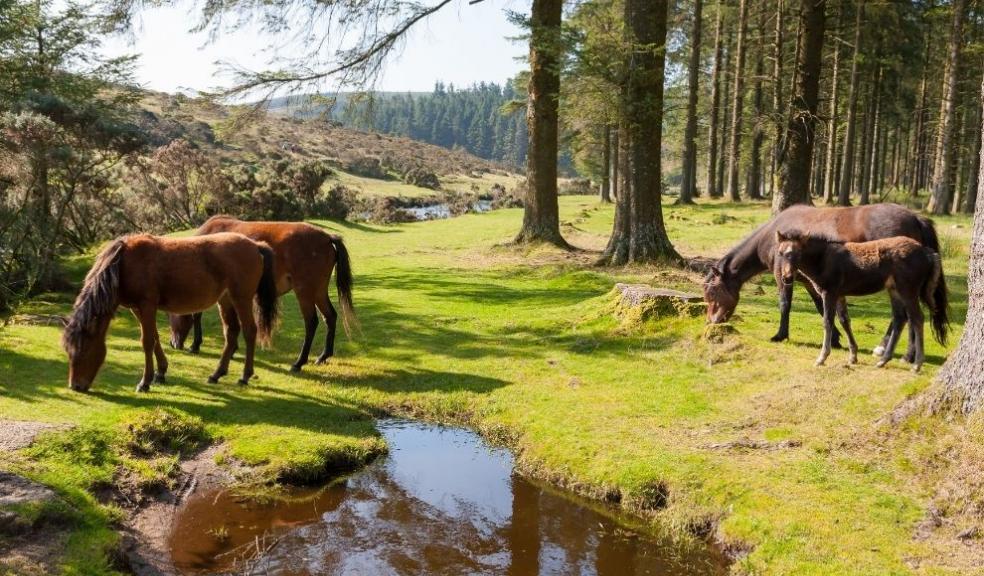
Research by estate and lettings agent, Barrows and Forrester, has revealed that while just 17% of local authorities across England have seen property transactions exceed pre-Covid conditions, the top 10 biggest market revivals have been around national parks and areas of outstanding natural beauty.
Barrows and Forrester analysed property transactions to have taken place since the welcome boost of a stamp duty holiday was introduced and how this market performance compares to the same time period prior to its introduction.
The latest available data (February 2021) shows that since the stamp duty holiday was introduced on the 8th July 2020, 341,086 property transactions have completed across England. Although an impressive revival, the research by Barrows and Forrester also shows the market isn’t quite back to full health.
378,723 homes were sold in the same time period prior to the SDLT holiday starting, meaning the market is still off the pace by some 37,637 transactions; a -10% difference.
National park market hotspots
However, this isn’t the case across the entire market and the figures from Barrows and Forrester show that as much as 17% of all local authorities have now seen more homes sold since the SDLT holiday came into play, when compared to the same time period previous.
When it comes to the biggest market revivals at local authority level, the top 10 areas are all located in and around either a national park or an area of outstanding natural beauty.
Cotswold is the area of the market in the finest health at present. 845 homes have sold in the area since 8th July 2020, 26% more than the same time period prior.
Copeland, close to the Lake District National Park, has seen transactions climb 23% higher, while there has been a 22% uplift in transactions in the New Forest.
South Hams, home to the South Devon AONB, has also seen one of the largest market revivals, with 18% more transactions since the stamp duty holiday was introduced.
Elmbridge (16%) and Woking (14%) lie just to the north of the Surrey Hills AONB, while Tandridge (11%) sits between the Surrey Hills and High Weald AONBs.
Also ranking within the top 10 is South Oxfordshire which sits between the North Wessex Downs and Chiltern Hills AONBs, while East Hertfordshire (13%) lies within reach of both the Chiltern Hills and Dedham Value AONBs.
Completing the top 10 is Ryedale where transactions are up 10% since the stamp duty holiday, with the area straddling the North York Moors National Park.
Managing Director of Barrows and Forrester, James Forrester, commented:
“There’s no doubt that the current stamp duty holiday has caused a dramatic turnaround in buyer activity, but we’re yet to see top-line transactions hit the same levels as they did prior to its introduction.
That said, a good chunk of the market has seen a complete revival and then some, with the number of homes sold now considerably higher than previous levels of market activity.
We know that a trend for larger homes in countryside locations has influenced the market due to a prolonged stint of lockdown restrictions. This trend is abundantly clear when analysing the areas of the market to have bounced back to the greatest extent and locations surrounding national parks and areas of outstanding natural beauty have proved incredibly popular with the nation’s homebuyers.
Although this is a trend that we expect to continue, it shouldn’t be long before a more substantial proportion of the market makes a full recovery aided by a return to normality as we ease out of lockdown.”
Contact us here if we can help you to find your next home.
5 Differences Between You Being A First Time Buyer And A Second Time Buyer
What To Do When Your Home Isn’T Selling – 8 Steps To Boost Your Marketing
Rental Market Revival As Tenant Demand Jumps 10% In Q1
|
Table shows the top 10 areas where property transactions have surpassed previous market levels since the stamp duty holiday was introduced |
|||||
|
Location |
Transactions pre-SDLT holiday |
Transactions since SDLT holiday |
Transactions Difference |
Transactions Difference (%) |
National Park or AONB |
|
COTSWOLD |
668 |
845 |
177 |
26% |
Cotswolds AONB |
|
COPELAND |
469 |
575 |
106 |
23% |
Lake District National Park |
|
NEW FOREST |
1,256 |
1,533 |
277 |
22% |
New Forest National Park |
|
SOUTH HAMS |
836 |
985 |
149 |
18% |
South Devon AONB |
|
ELMBRIDGE |
1,020 |
1,179 |
159 |
16% |
Surrey Hills AONB |
|
WOKING |
640 |
729 |
89 |
14% |
Surrey Hills AONB |
|
SOUTH OXFORDSHIRE |
1,029 |
1,167 |
138 |
13% |
Chiltern Hills and North Wessex Downs AONB |
|
EAST HERTFORDSHIRE |
1,078 |
1,213 |
135 |
13% |
Chiltern Hills AONB and Dedham Vale AONB |
|
TANDRIDGE |
580 |
641 |
61 |
11% |
Surrey Hills and High Weald AONB |
|
RYEDALE |
455 |
500 |
45 |
10% |
North York Moors National Park |
|
ENGLAND |
378,723 |
341,086 |
-37,637 |
-10% |
N/A |
|
15 November 2019 to 7th July 2020 |
8th July 2020 to 28th February 2020 - latest data available |
||||
|
Transactions based on Category Type A transactions (primary not secondary home purchases) for residential homes purchased at £40,000 or above, excluding properties categorised as 'other'. |
|||||


